See exactly where your Mac is talking on the network.
Tapped is a native macOS network dashboard that shows you exactly where your computer is talking — which apps, which destinations, how much data, and for how long. It sits in the space between “I have no idea what my Mac is doing on the network” and “I need Wireshark.”
Requires macOS 14 (Sonoma) or later
Why Tapped?
Every app on your Mac is making network connections — some expected, some surprising. Tapped gives you the visibility to build a mental model of what “normal” looks like so you can spot anomalies. It’s a defensive visibility tool, not a firewall or blocker. You observe first, then decide.
No agents, no kernel extensions, no custom network stack. Tapped orchestrates the system tools already on your Mac (lsof, nettop, tcpdump) and presents what they find in a clean, visual dashboard.
Features
Overview
Live download/upload bandwidth meters, traffic history sparkline, and top destination organizations — all at a glance.
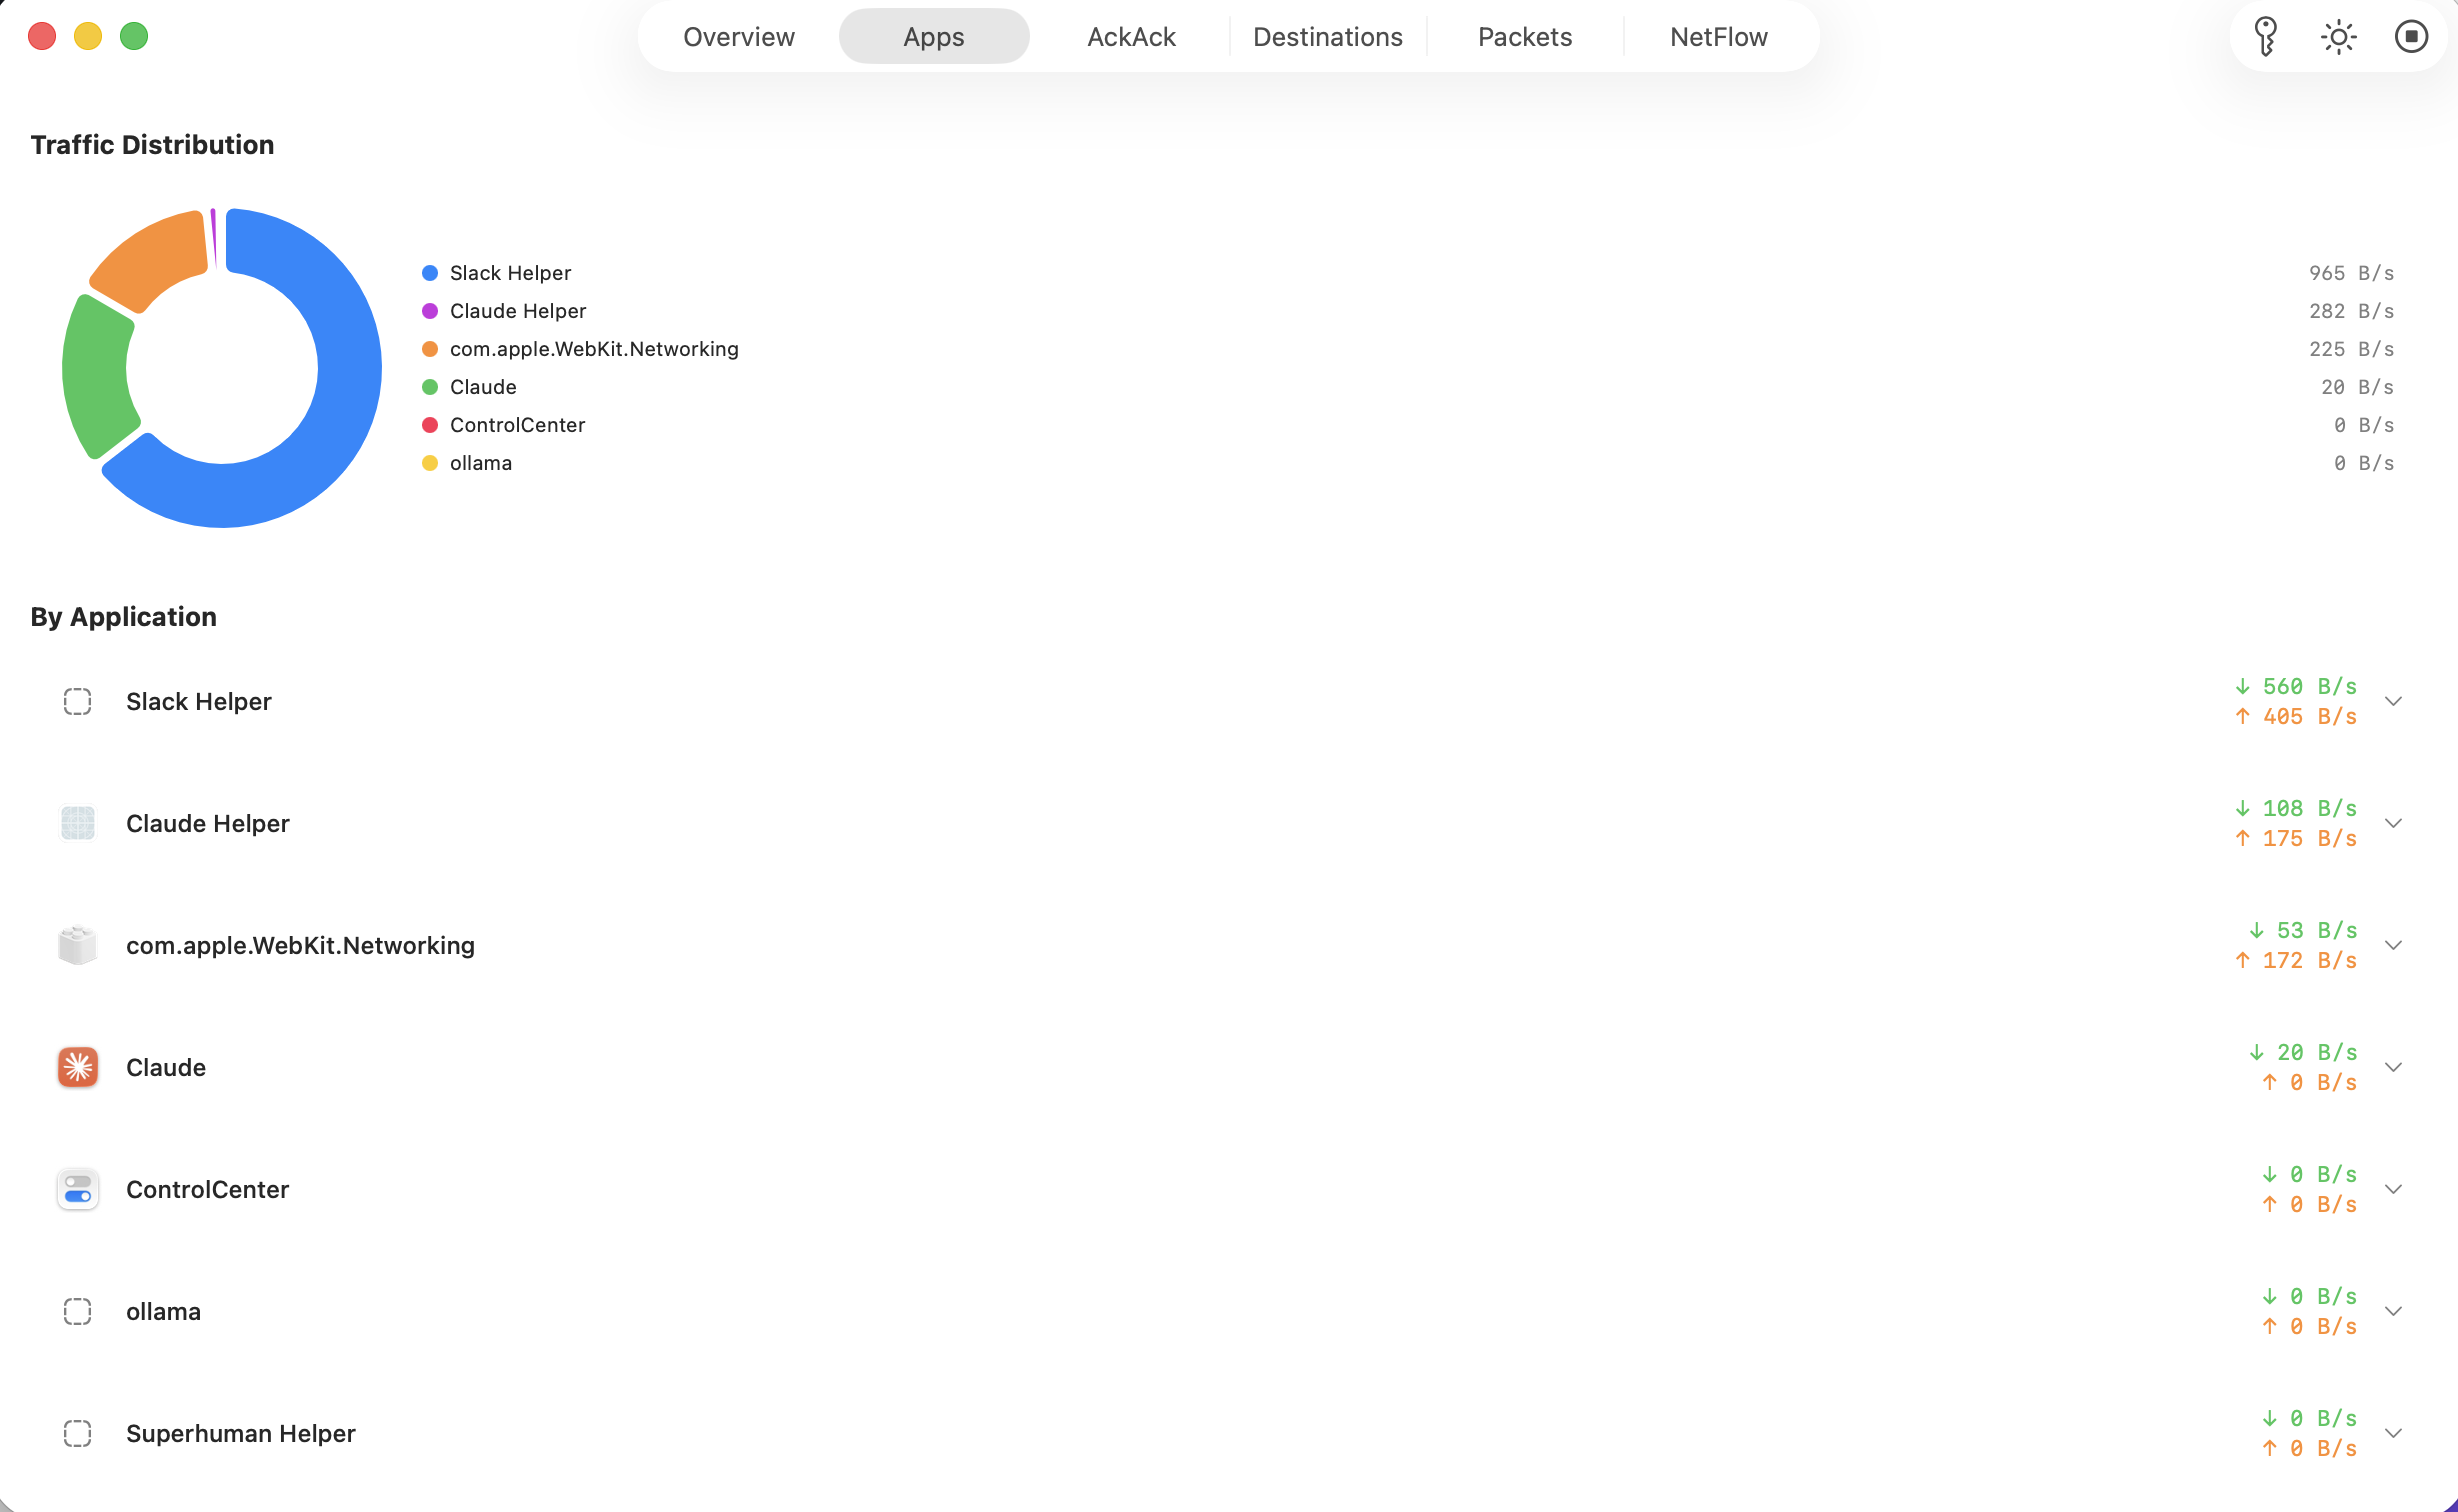
Apps
Per-process traffic breakdown with a donut chart showing which apps use the most bandwidth, with per-app upload and download rates.
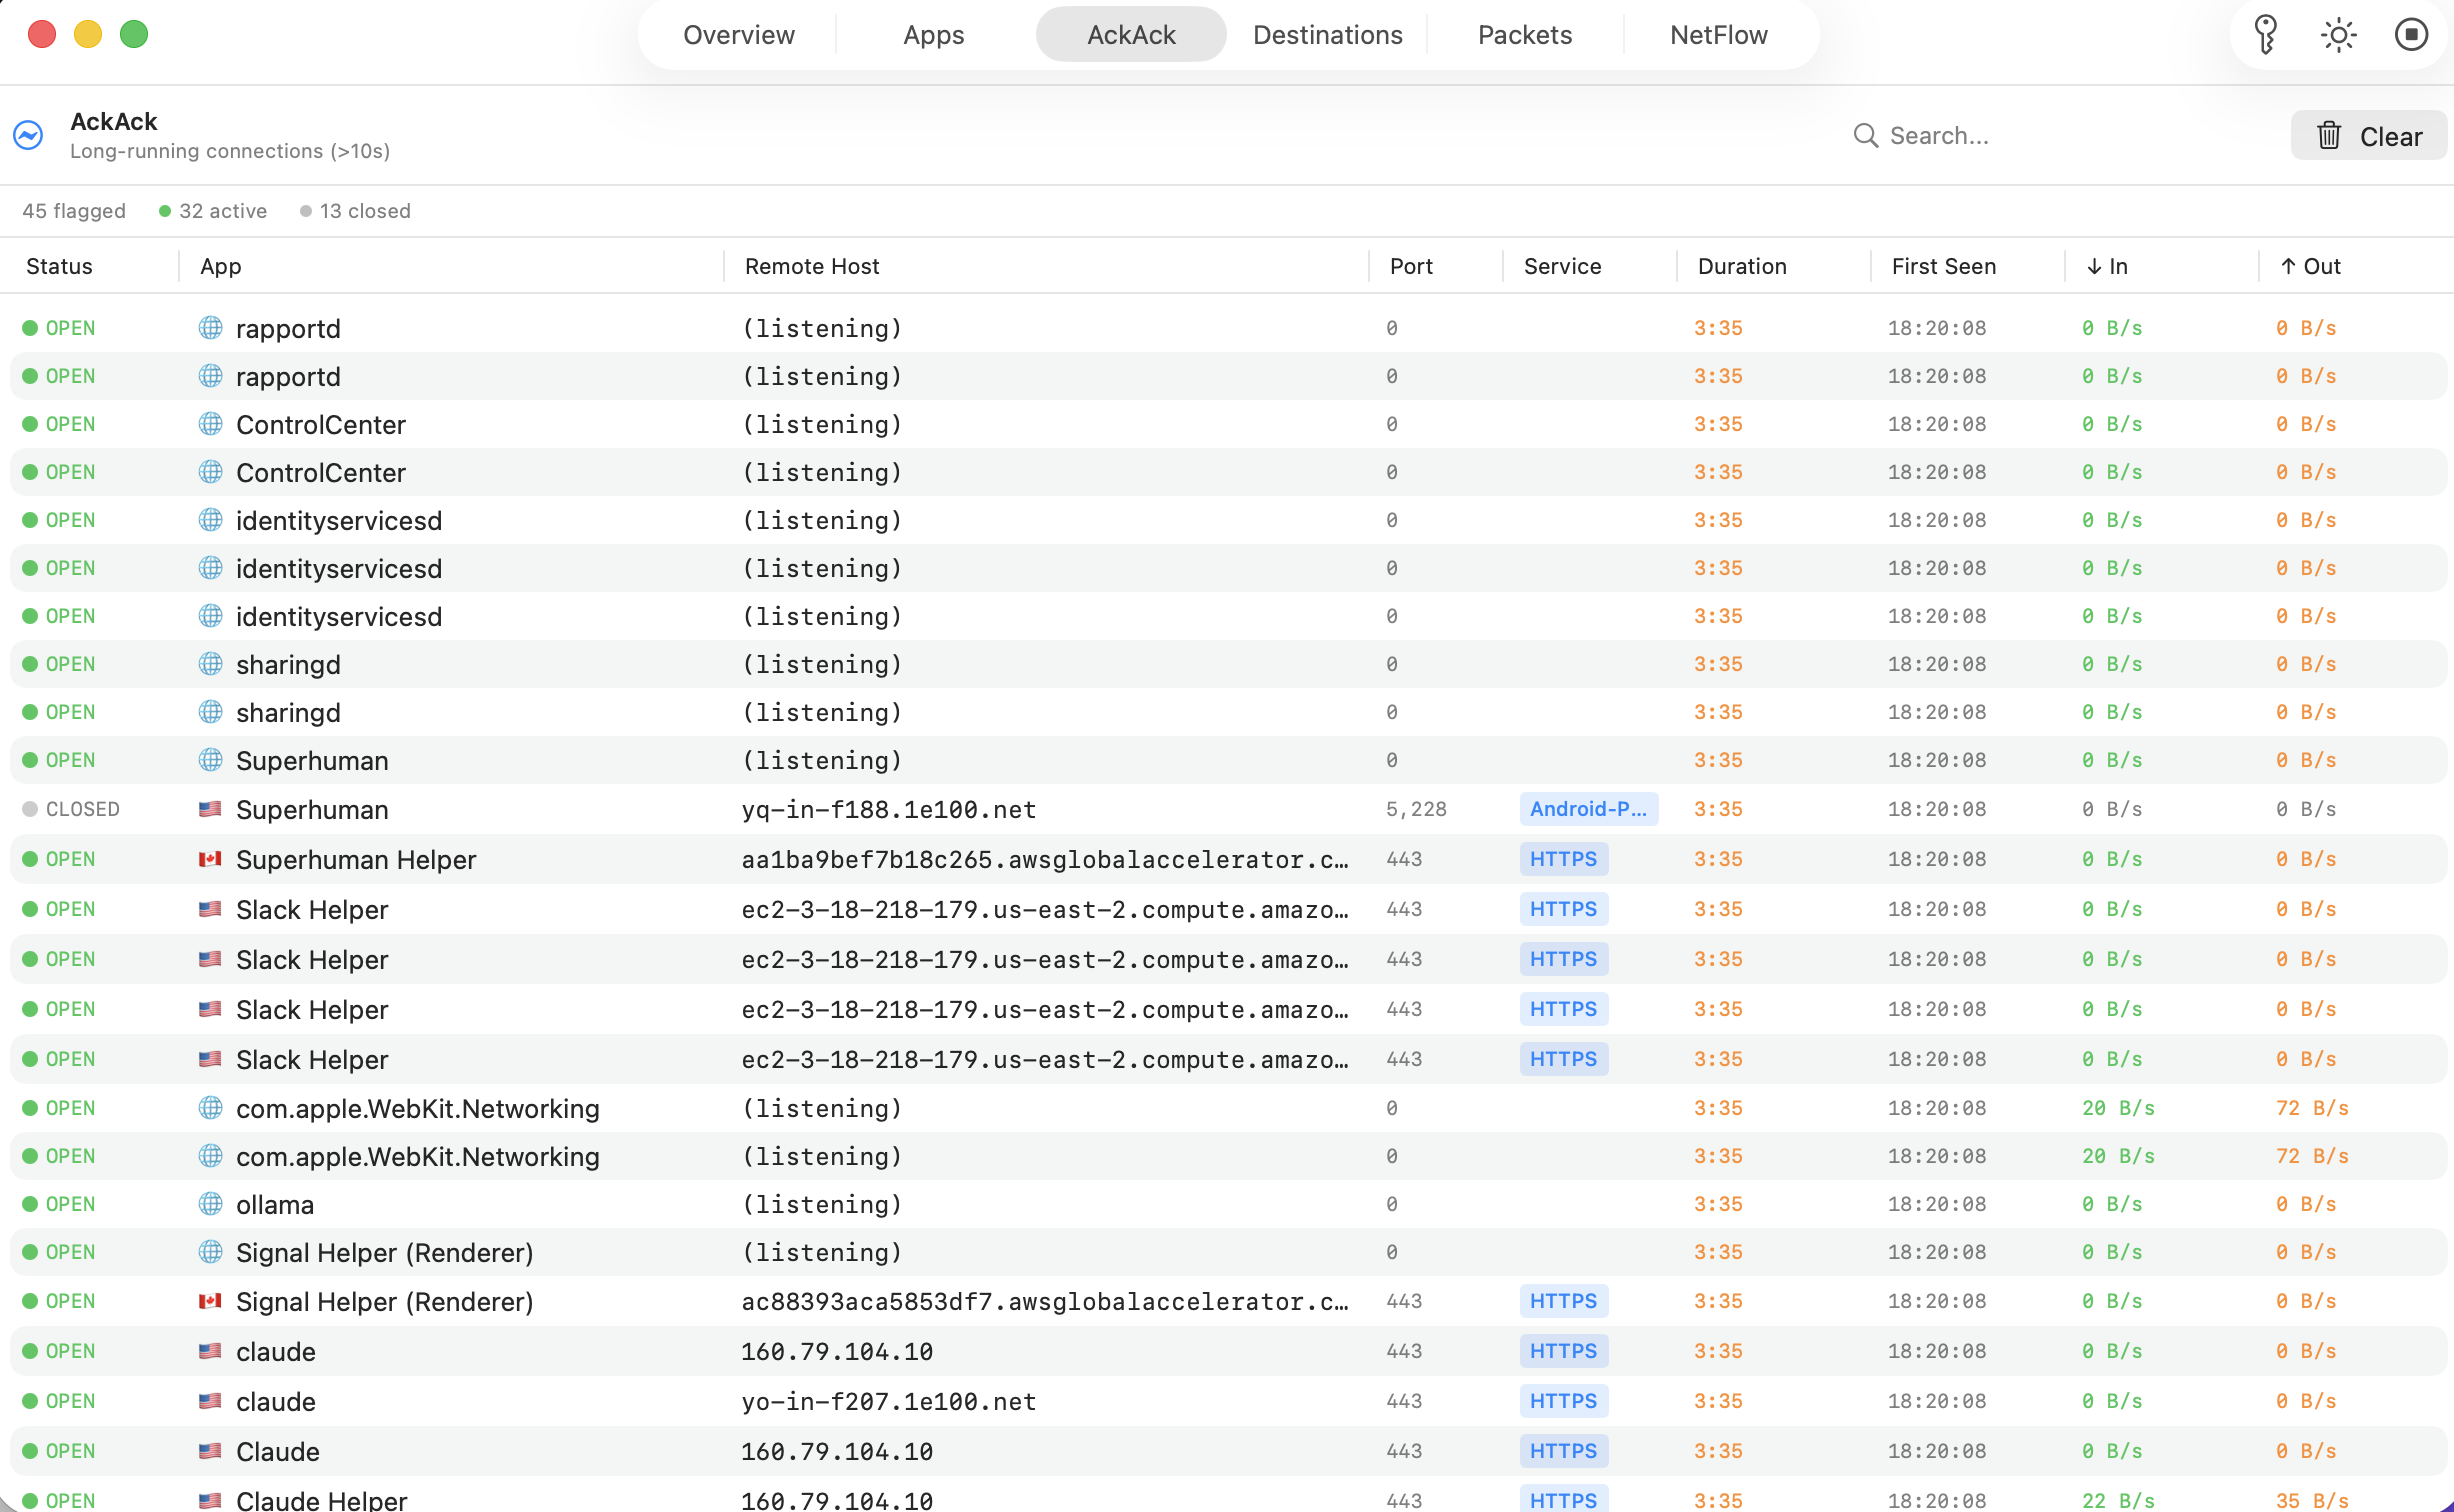
AckAck
Monitor long-running connections open for more than 10 seconds. Inspired by SpiderLabs' AckAck for detecting persistent channels.
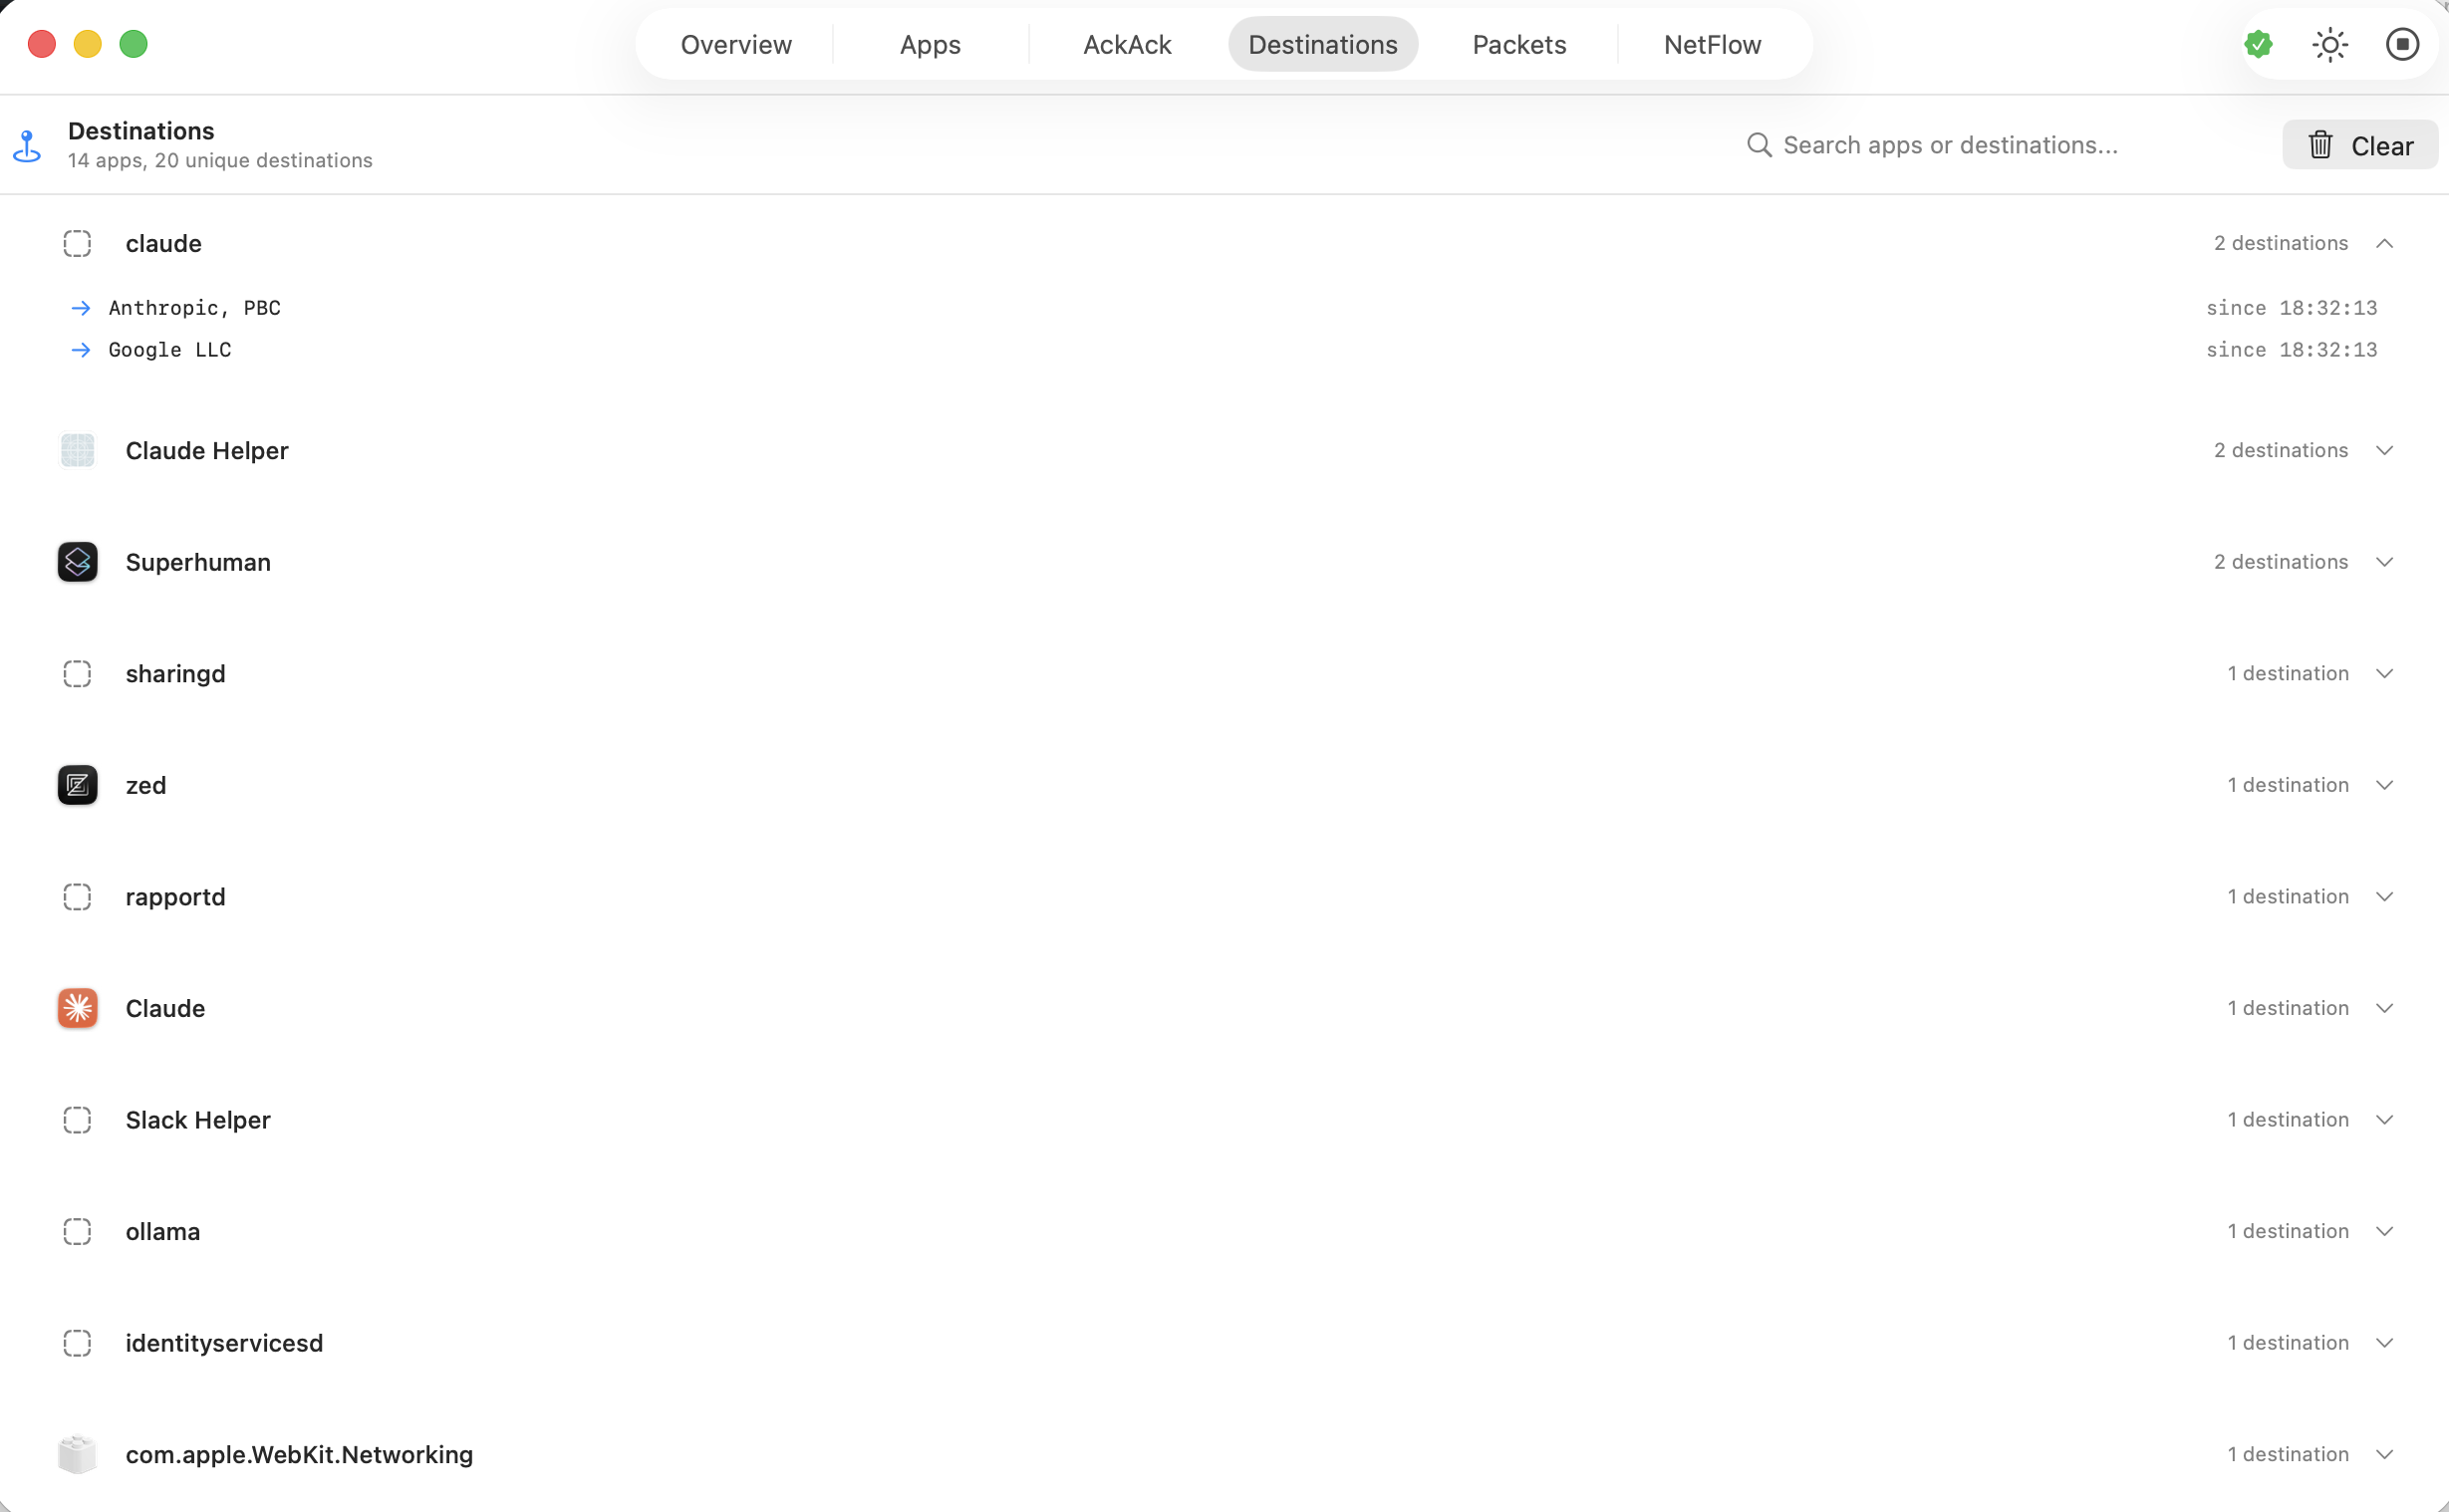
Destinations
Accumulated history of every unique destination each app has contacted during the session, with organization and geo data.
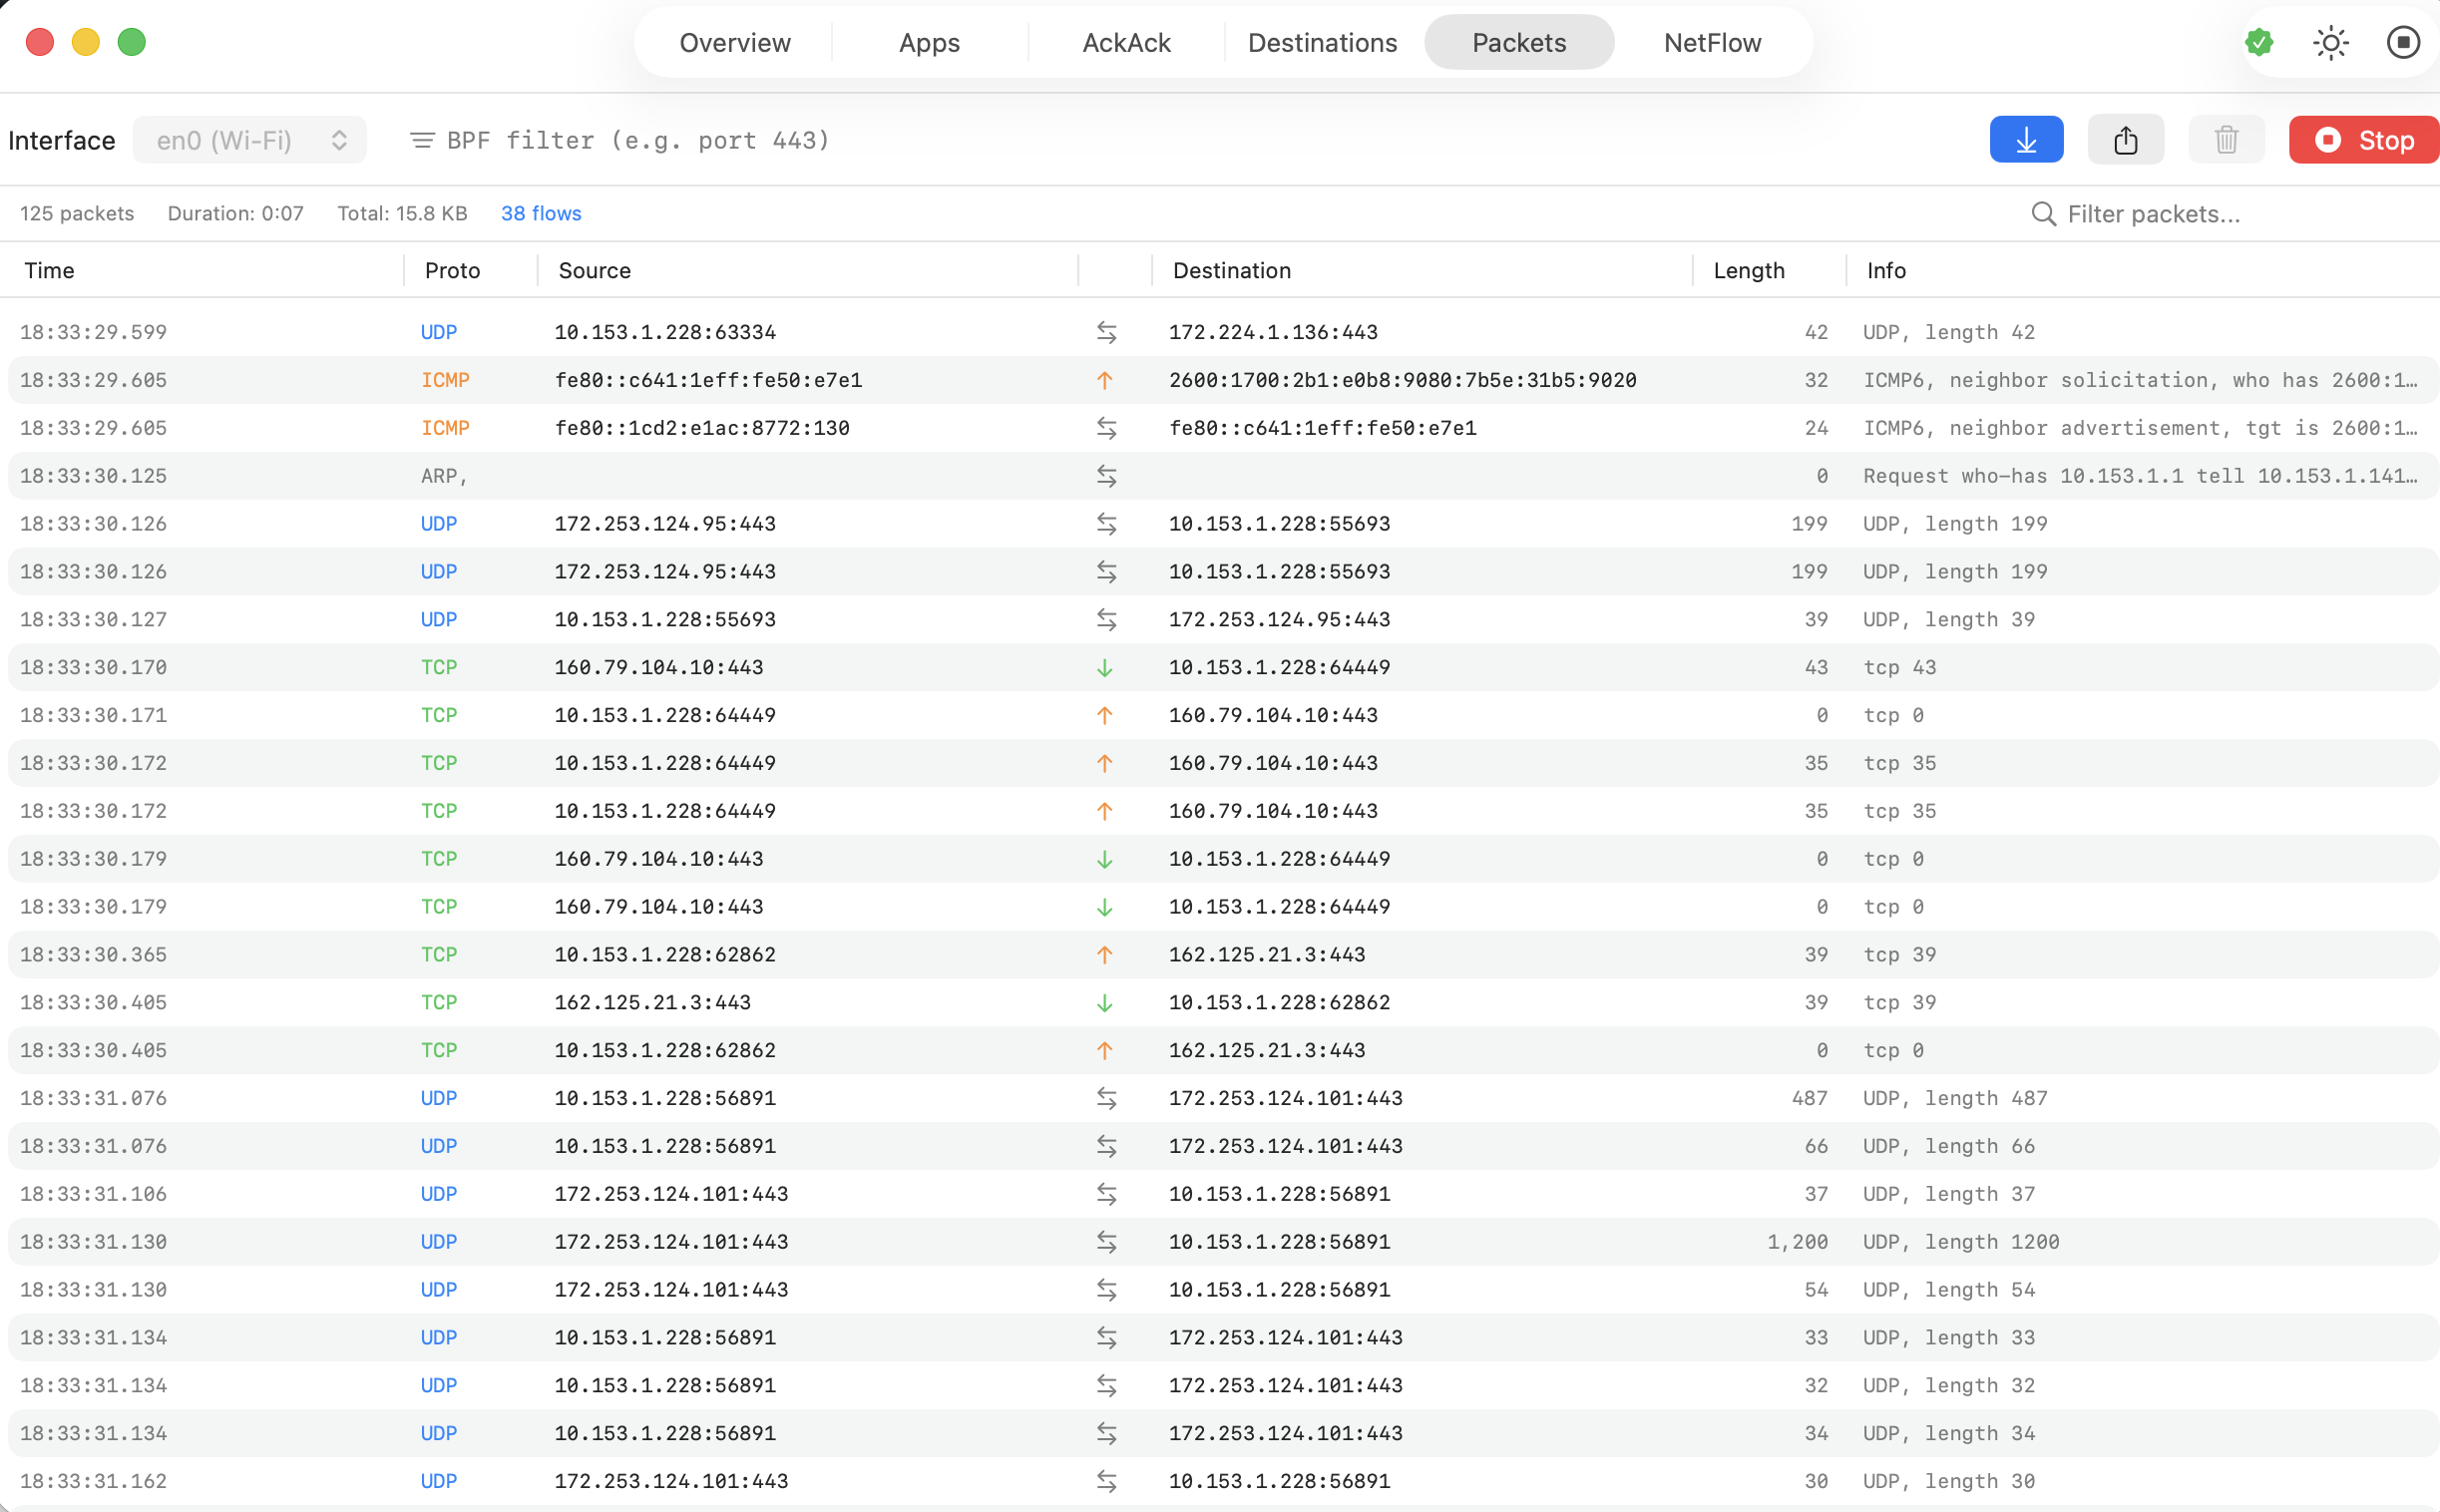
Packets
Real-time packet capture via tcpdump with protocol coloring, direction indicators, and BPF filter support.
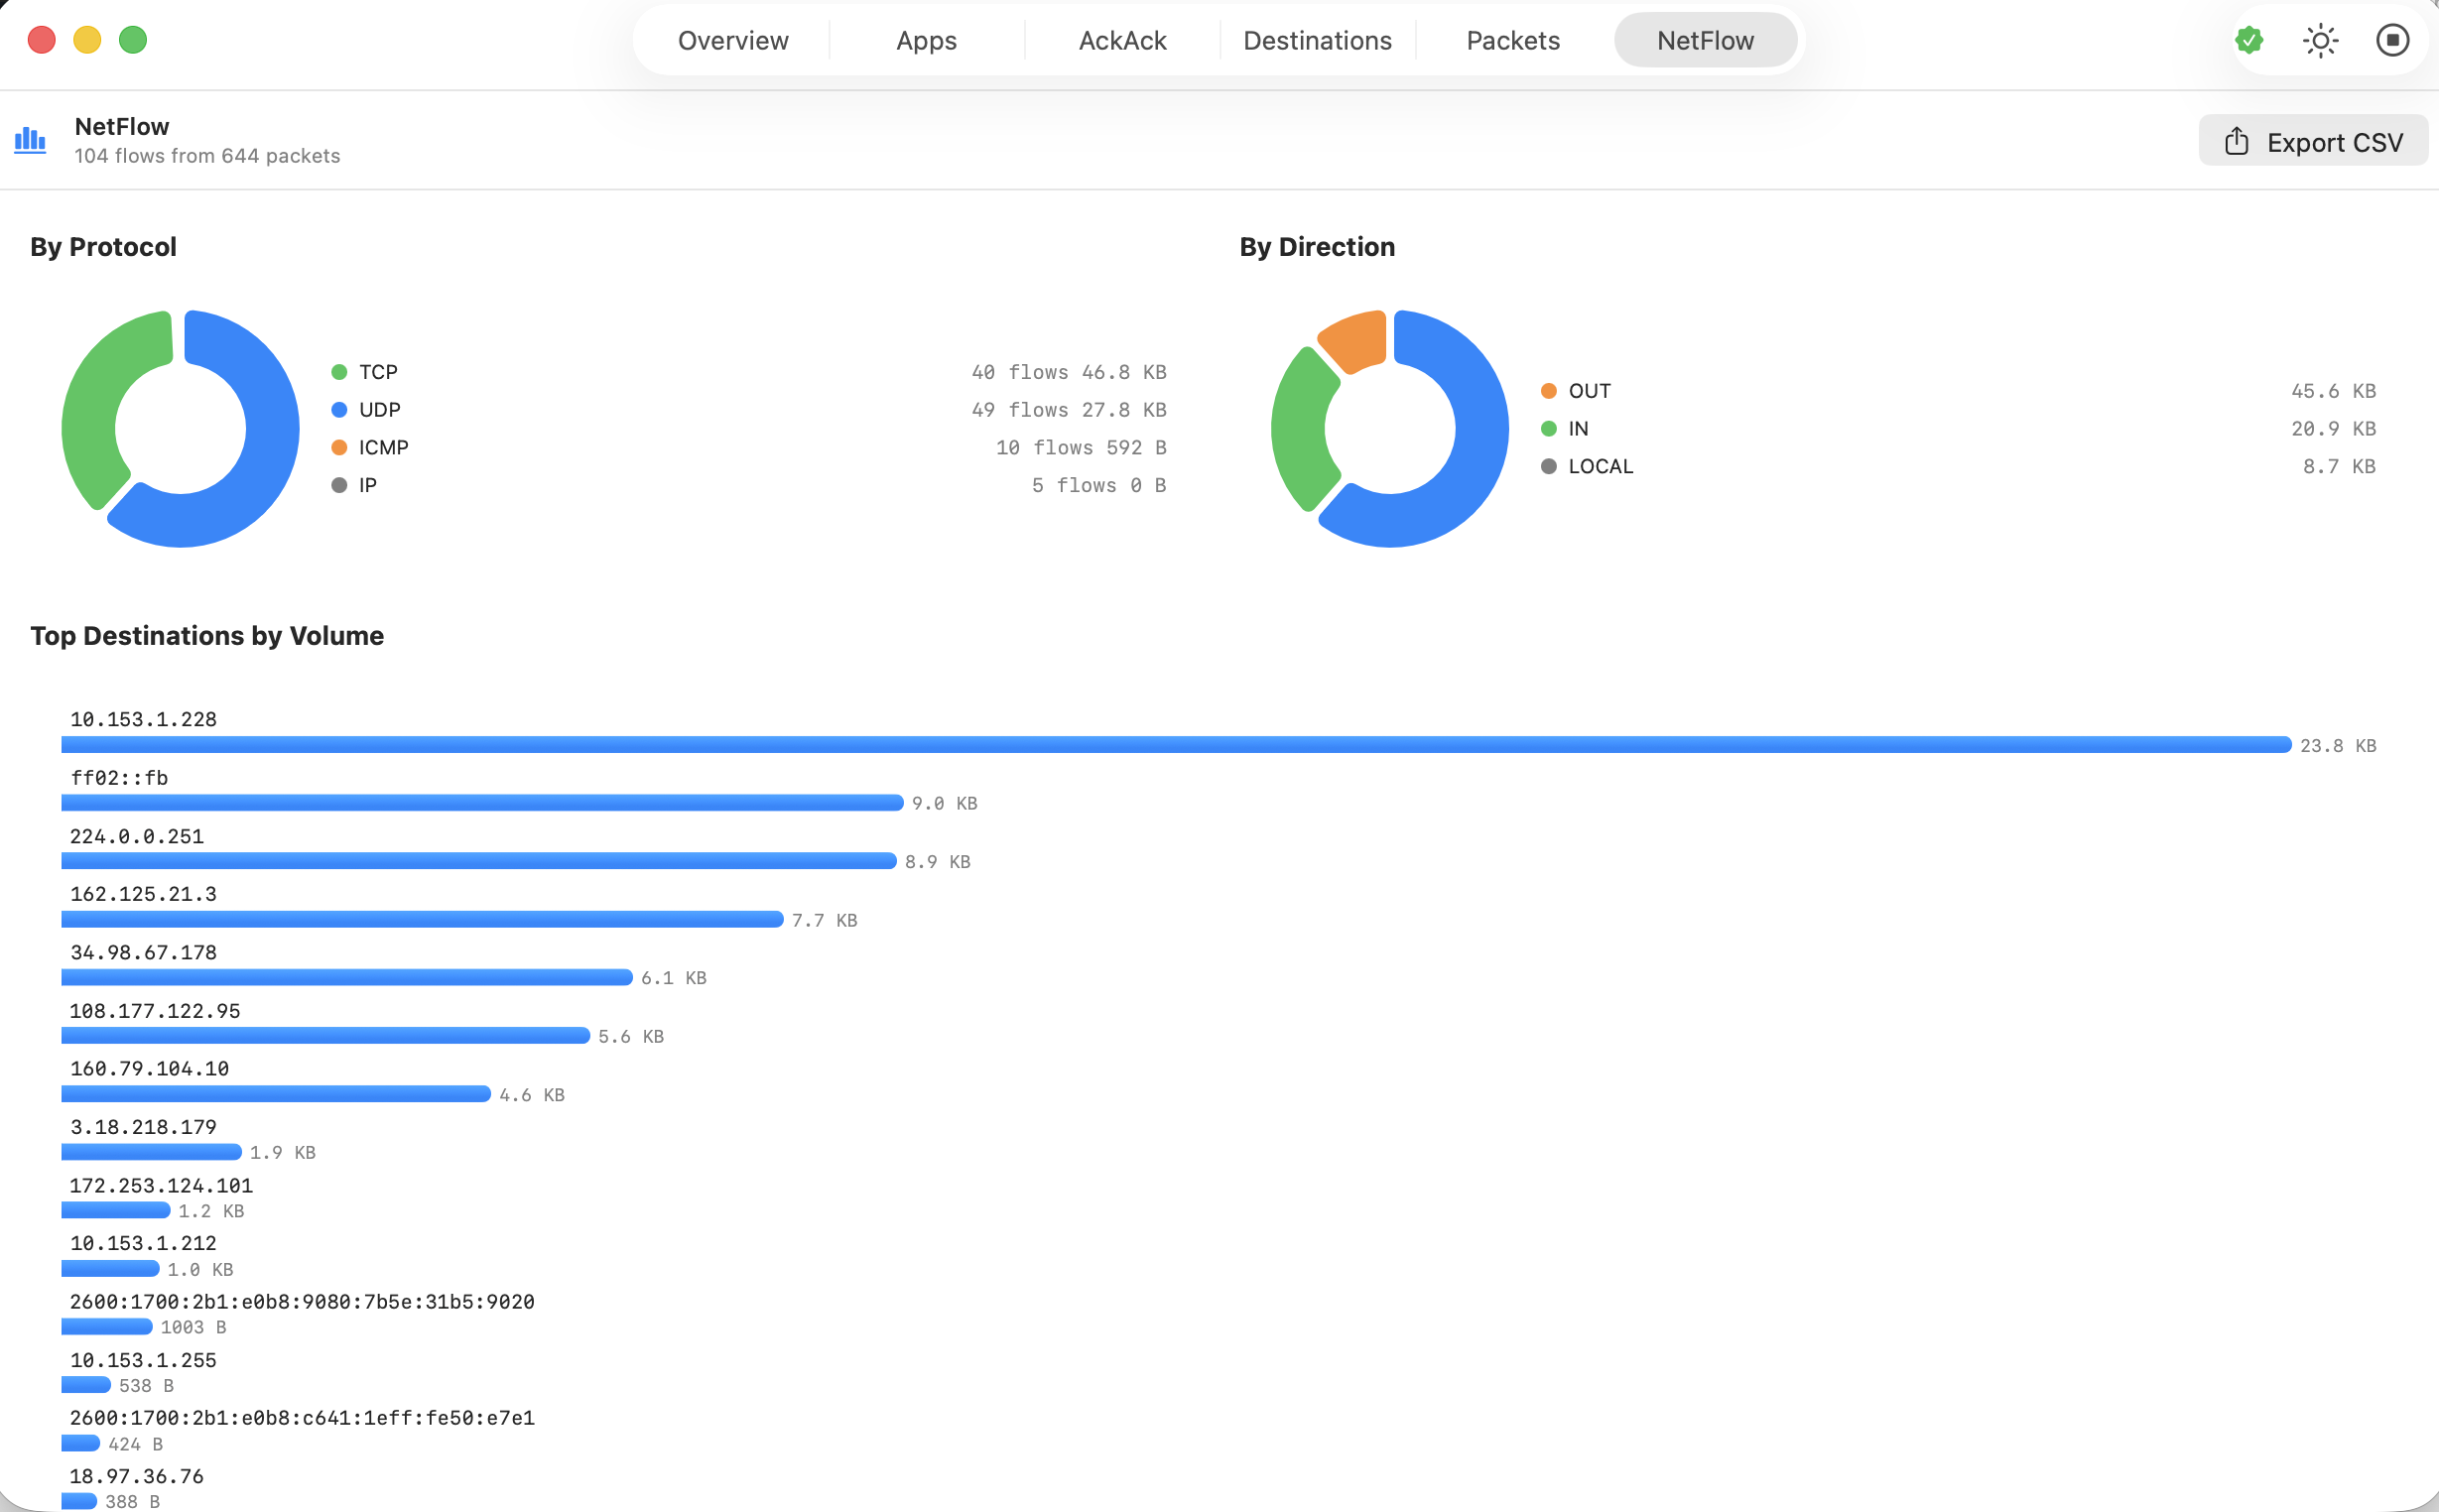
NetFlow
Visual summary of traffic flows — protocol and direction breakdowns, top destinations by volume, and CSV export for further analysis.
Auto-Update
Built-in update checking via Sparkle. Get notified of new versions automatically, with cryptographically verified downloads.
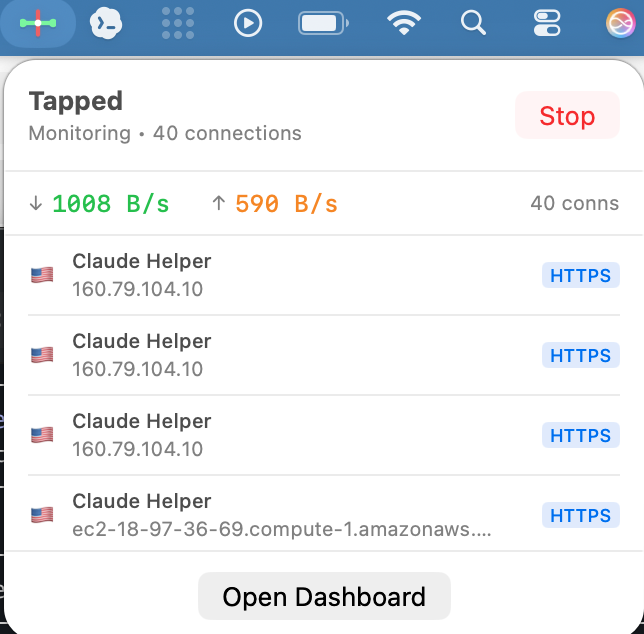
Menu Bar
Tapped lives in your menu bar so you always have a compact view of your connection count, current bandwidth, and active connections. Click to see details or open the full dashboard.
Apps
See exactly which applications are using your network and how much bandwidth each one consumes. The traffic distribution chart gives you an instant visual breakdown.
AckAck
Long-running connections can indicate persistent channels — things like websockets, streaming connections, or processes that maintain constant contact with remote servers. AckAck surfaces connections that have been open for more than 10 seconds so you can see what’s holding on.
Destinations
Track every unique destination each app talks to during your session. Destinations are enriched with reverse DNS, IP geolocation, and organization data so you can see that a connection goes to “Anthropic, PBC” rather than a raw IP address.
Packets
Full packet capture with a familiar table layout — time, protocol, source, destination, length, and info. Supports BPF filters for targeted capture and color-coded protocols for quick scanning.
NetFlow
A high-level visual summary of your captured traffic. See protocol and direction breakdowns as donut charts, top destinations by volume as a bar chart, and export everything to CSV for analysis in other tools.
Technical Details
- Native macOS app built with Swift and SwiftUI
- Sparkle auto-update — the only third-party dependency, for secure update delivery
- No kernel extensions — orchestrates
lsof,nettop, andtcpdump - Lightweight — capped data collections keep memory use bounded
- Privacy-respecting — all data stays on your machine; no telemetry, no analytics (the only outbound requests are traffic monitoring lookups and the update check to subversivesoftware.org)